Web & Apps
Offline-First Field Data Collection App (PWA)
for The Watershed Project
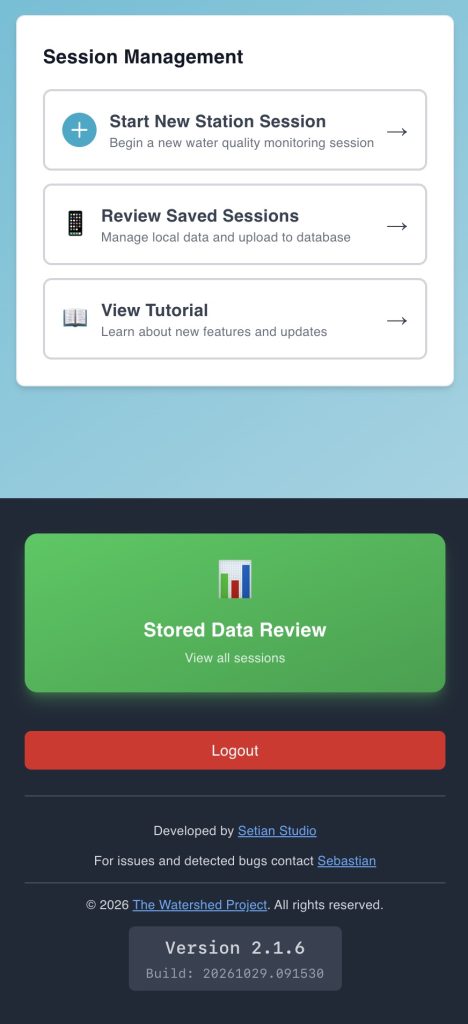
Watershed Watch is a mobile-first, offline-first Progressive Web App built for The Watershed Project’s water-quality monitoring program in the East Bay. Volunteers, team leaders and scientists use it at the creek to record observations and measurements, even without a signal; sessions sync to the organization’s database when connectivity returns and export directly in the formats regulators and partners need.
What it does
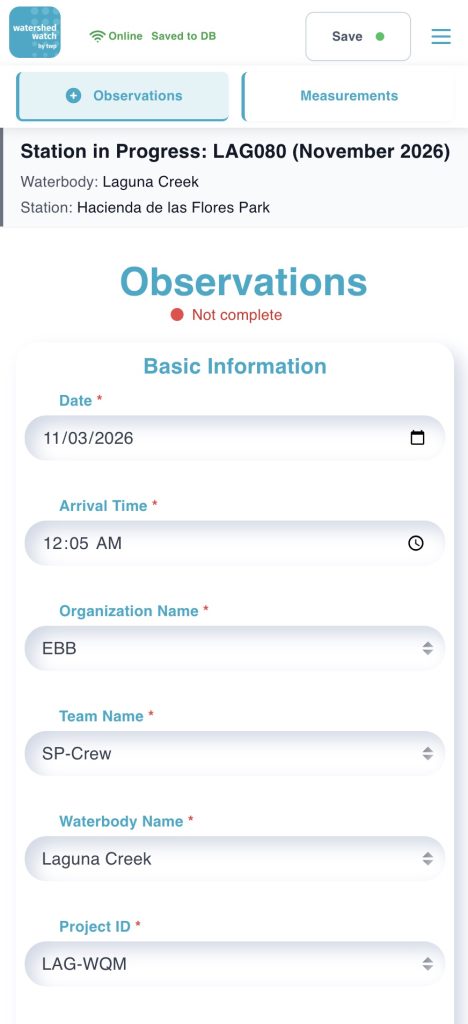
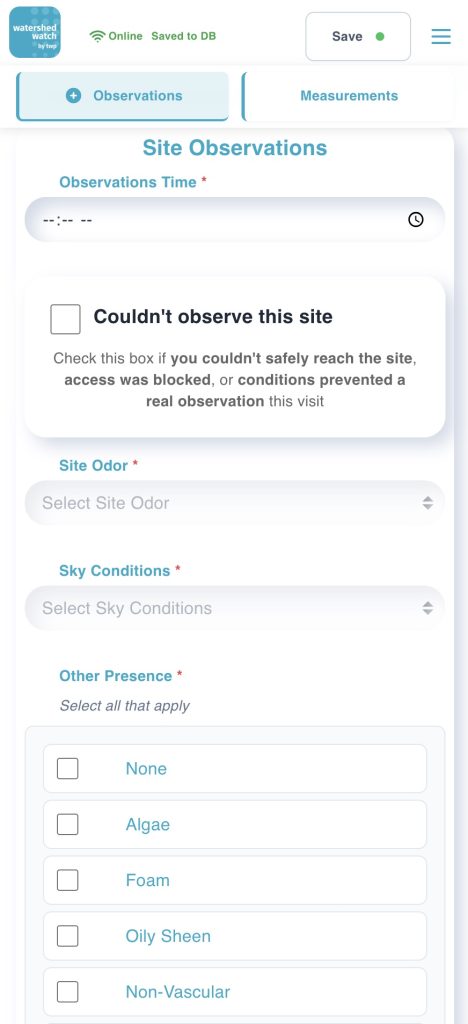
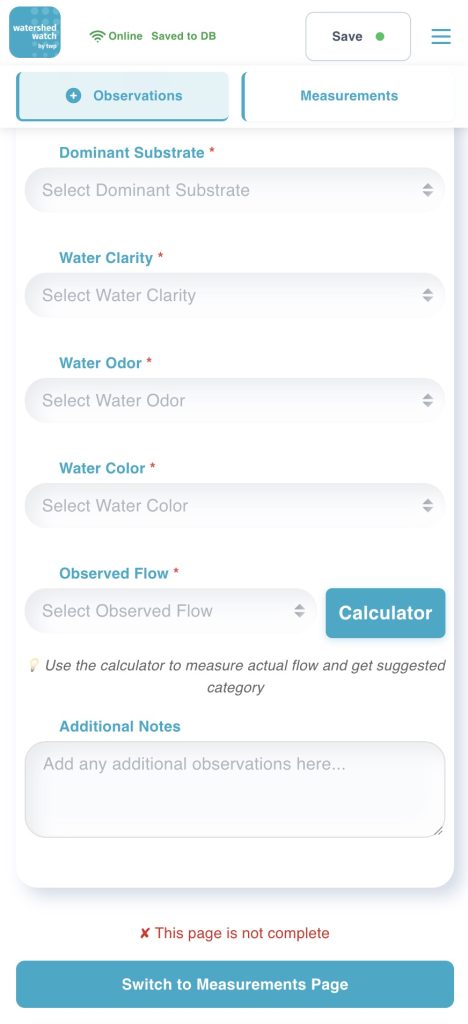
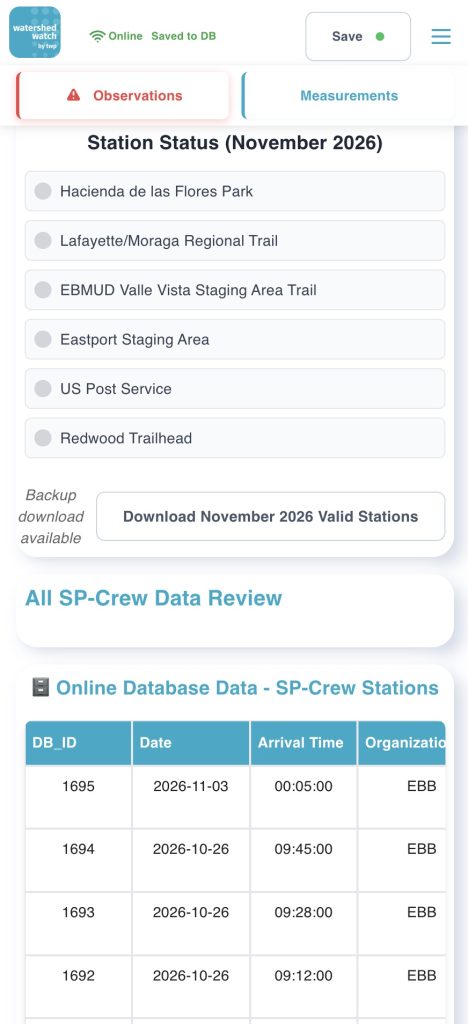
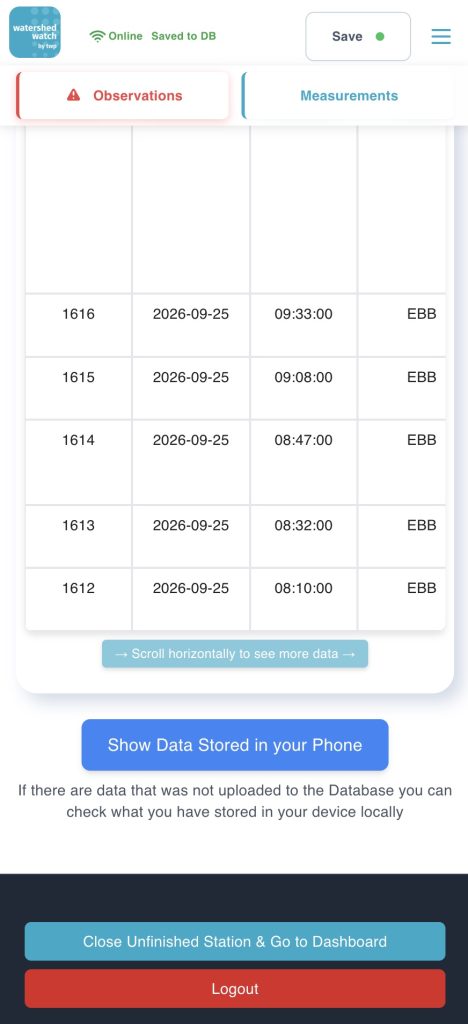
- Field sessions that work offline: station, team and site observations are entered in the field and stored on the device first, then synced when the phone is back online.
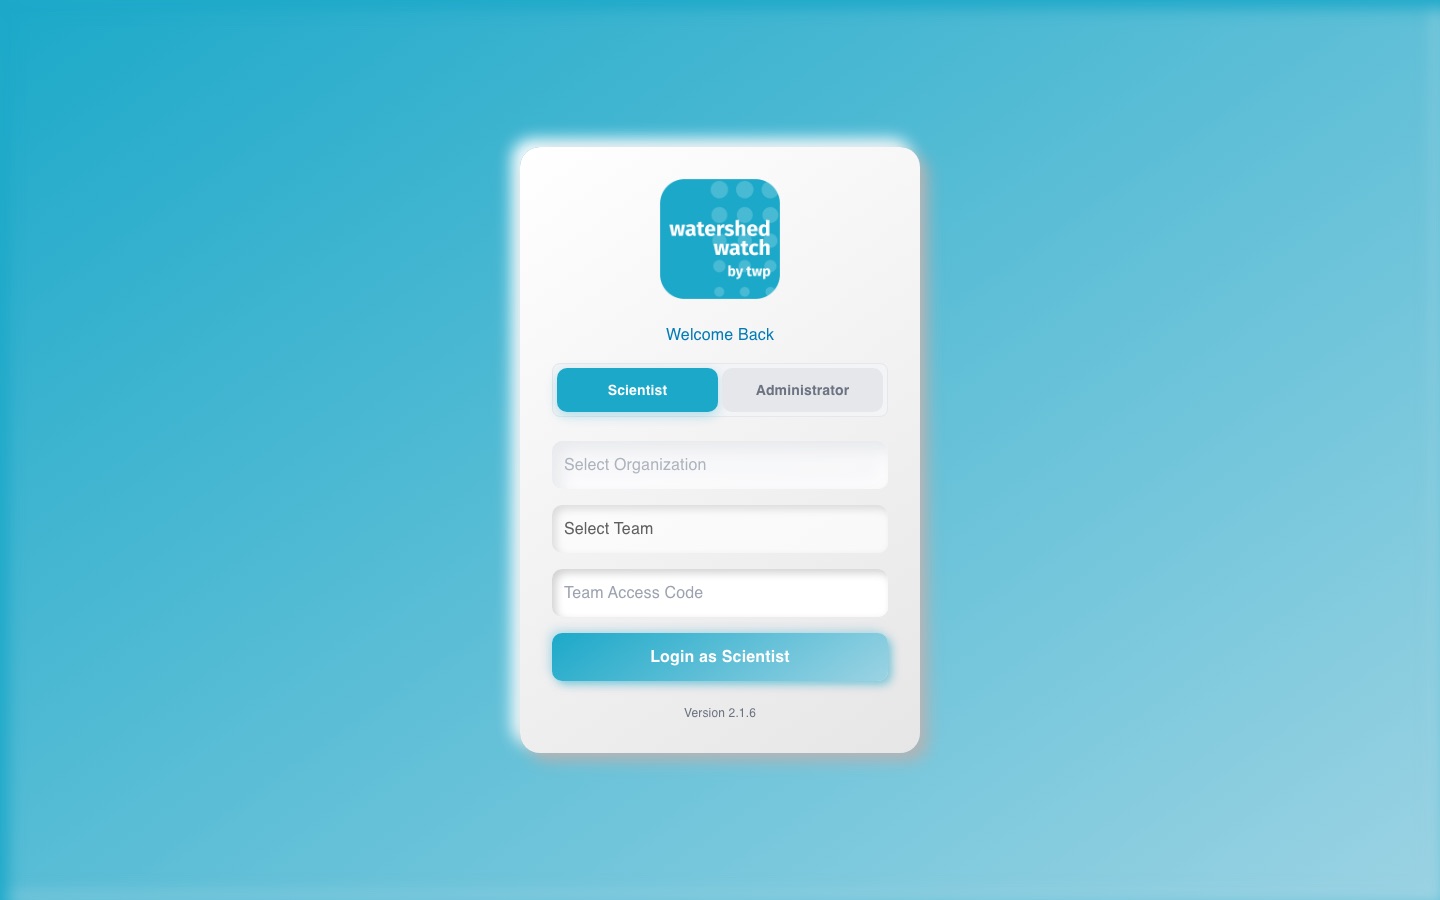
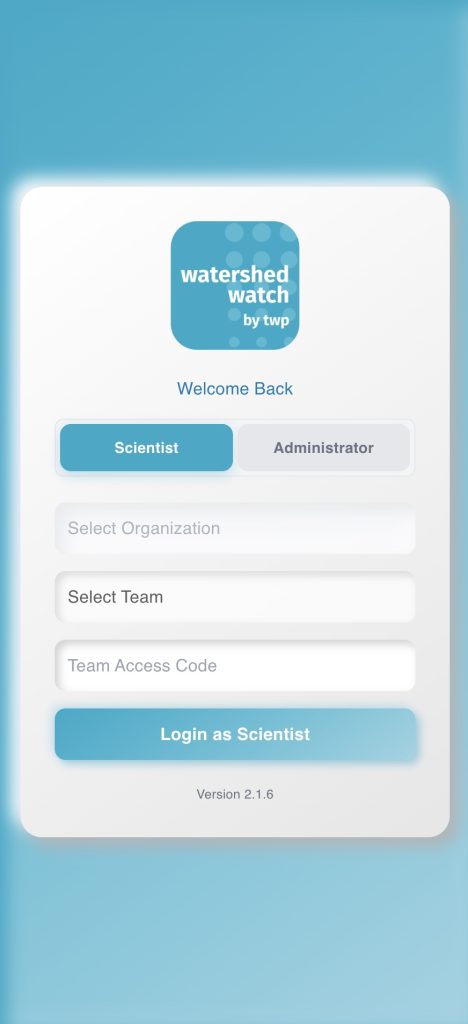
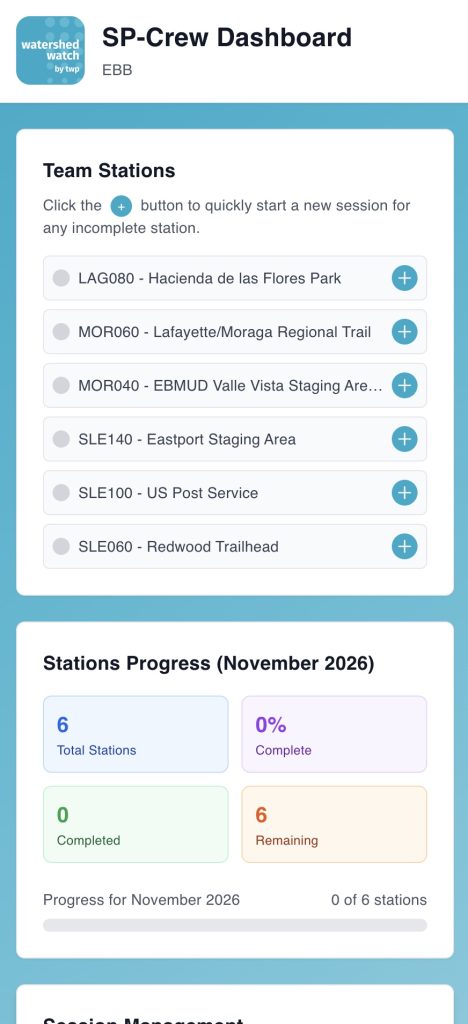
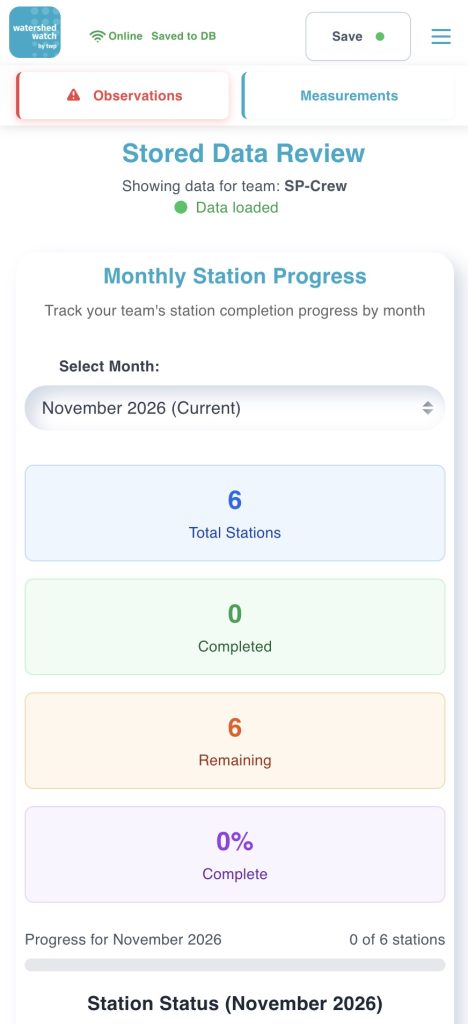
- Team access-code login: each monitoring crew signs in with its own code and sees only its own stations.
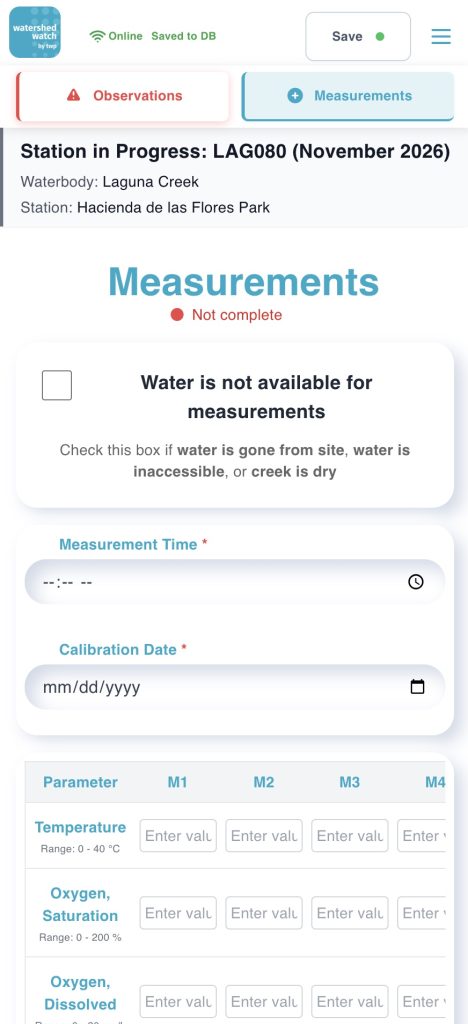
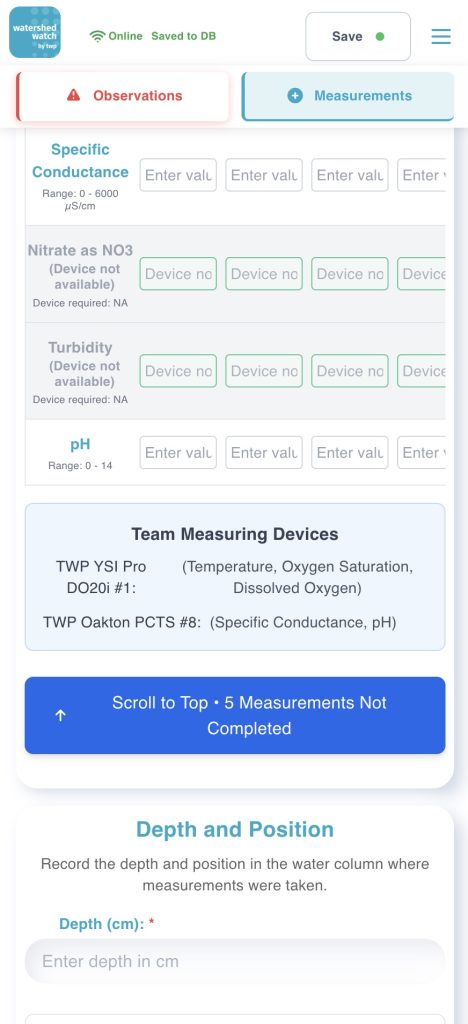
- Seven water-quality parameters, four replicates each: temperature, pH, turbidity, dissolved oxygen, oxygen saturation, specific conductance and nitrate, with notes per parameter.
- Real-time validation: replicate readings must agree within 10% of their average, flagged as the volunteer types so bad readings are caught at the creek, not back at the office.
- Two entry modes: one-parameter-at-a-time cards for guided entry, or an all-parameters batch table that is keyboard-friendly for experienced teams.
- Water-not-available handling: dry or unobservable stations are recorded explicitly instead of leaving gaps.
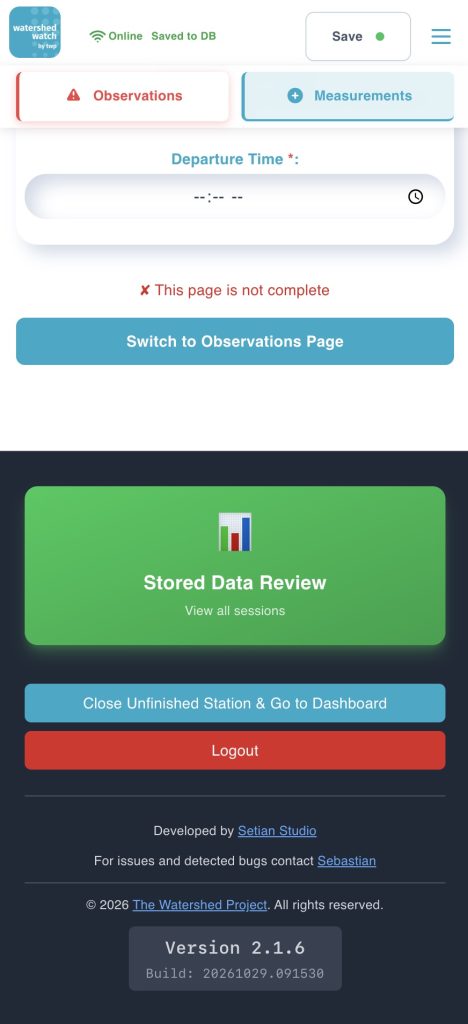
- Review before submit: a session summary page lets teams check everything before it is finalized.
Images
Data exports
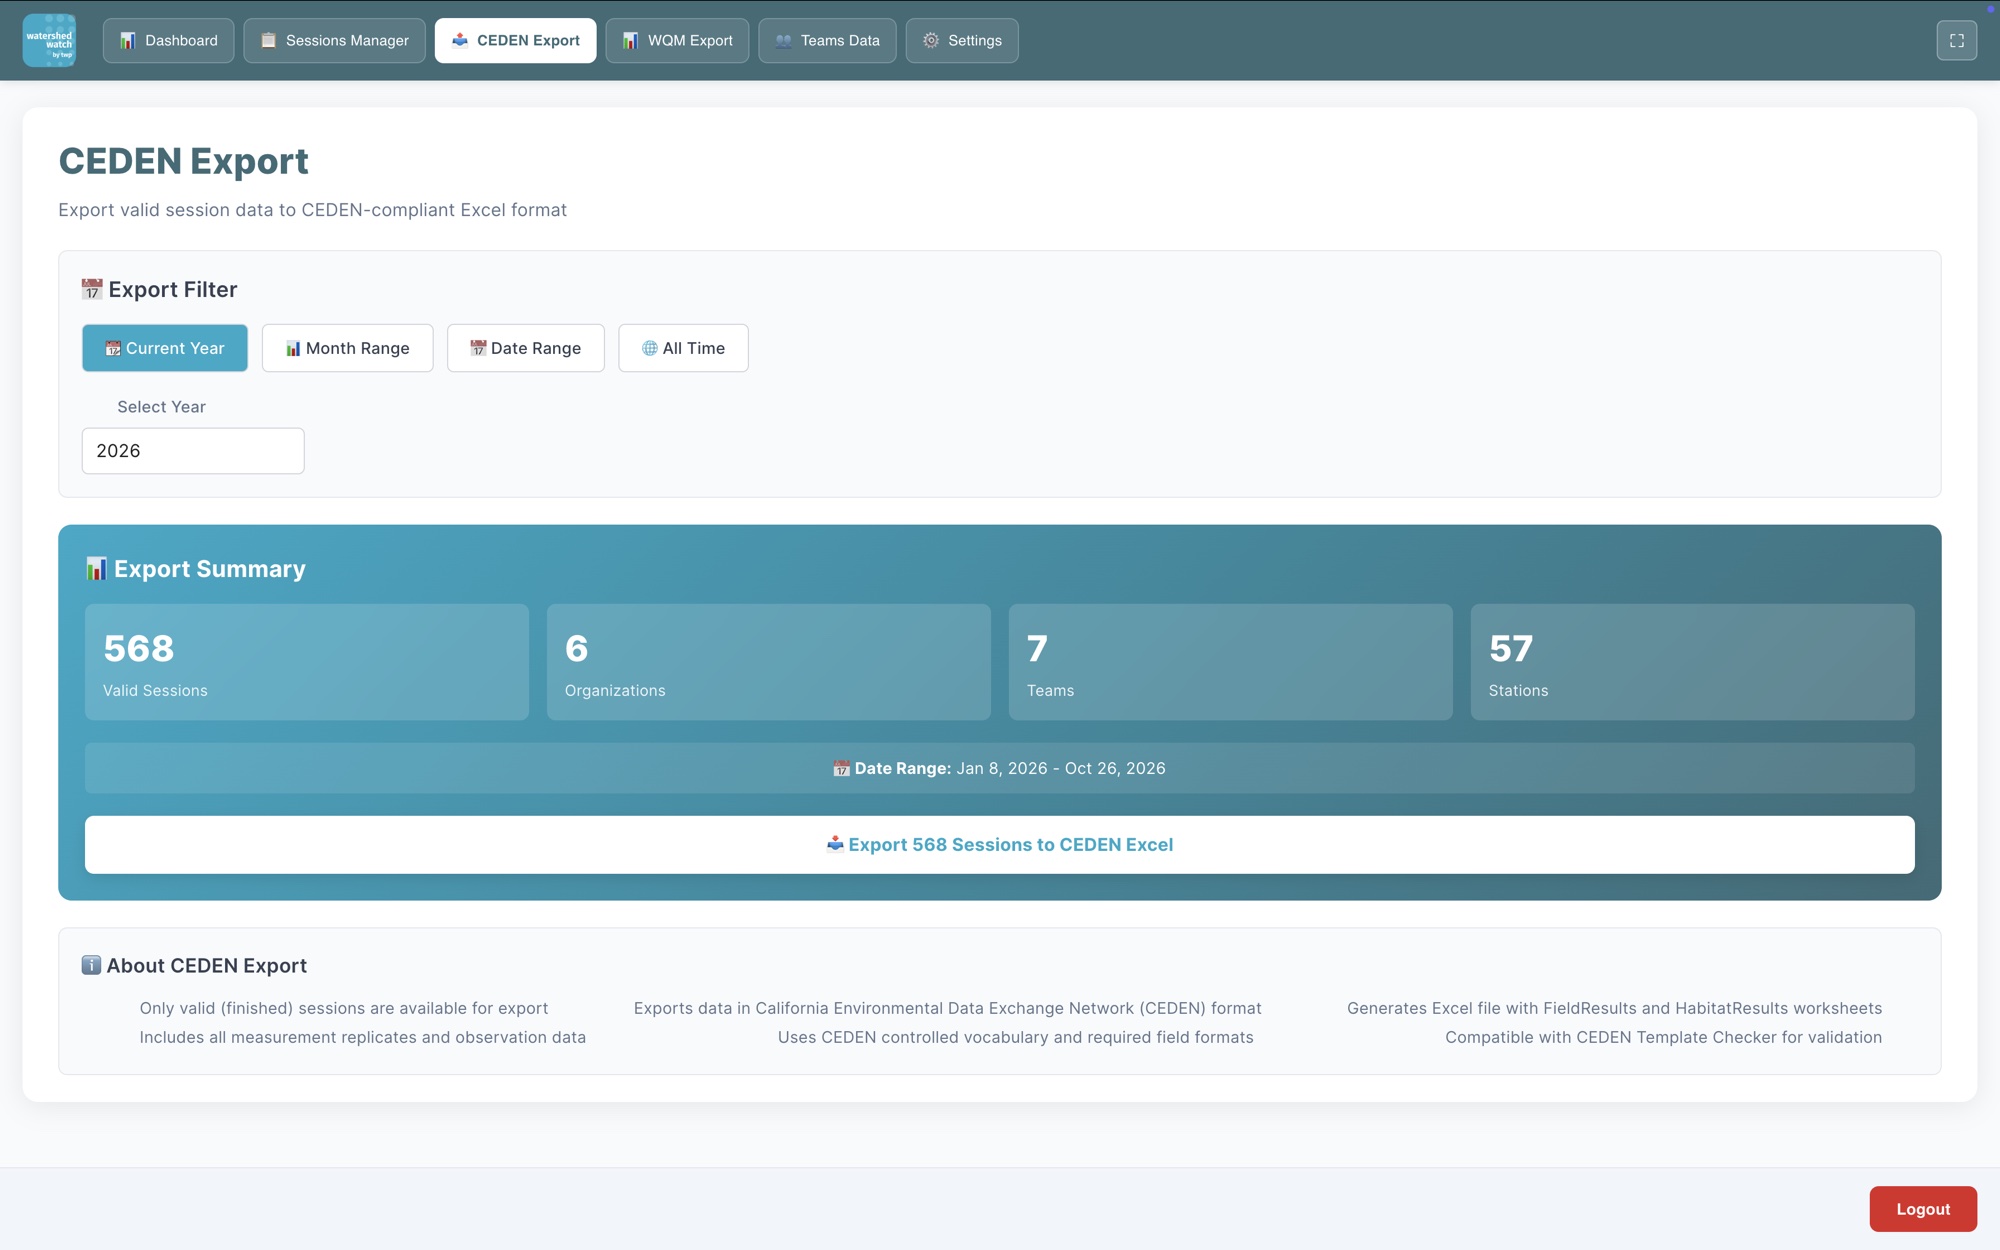
- CEDEN export: an Excel workbook (field results, habitat results and locations) in the California Environmental Data Exchange Network format, with the code mappings the state template requires.
- WQM export: a CSV for The Watershed Project’s water-quality visualization tool.
Administrator portal
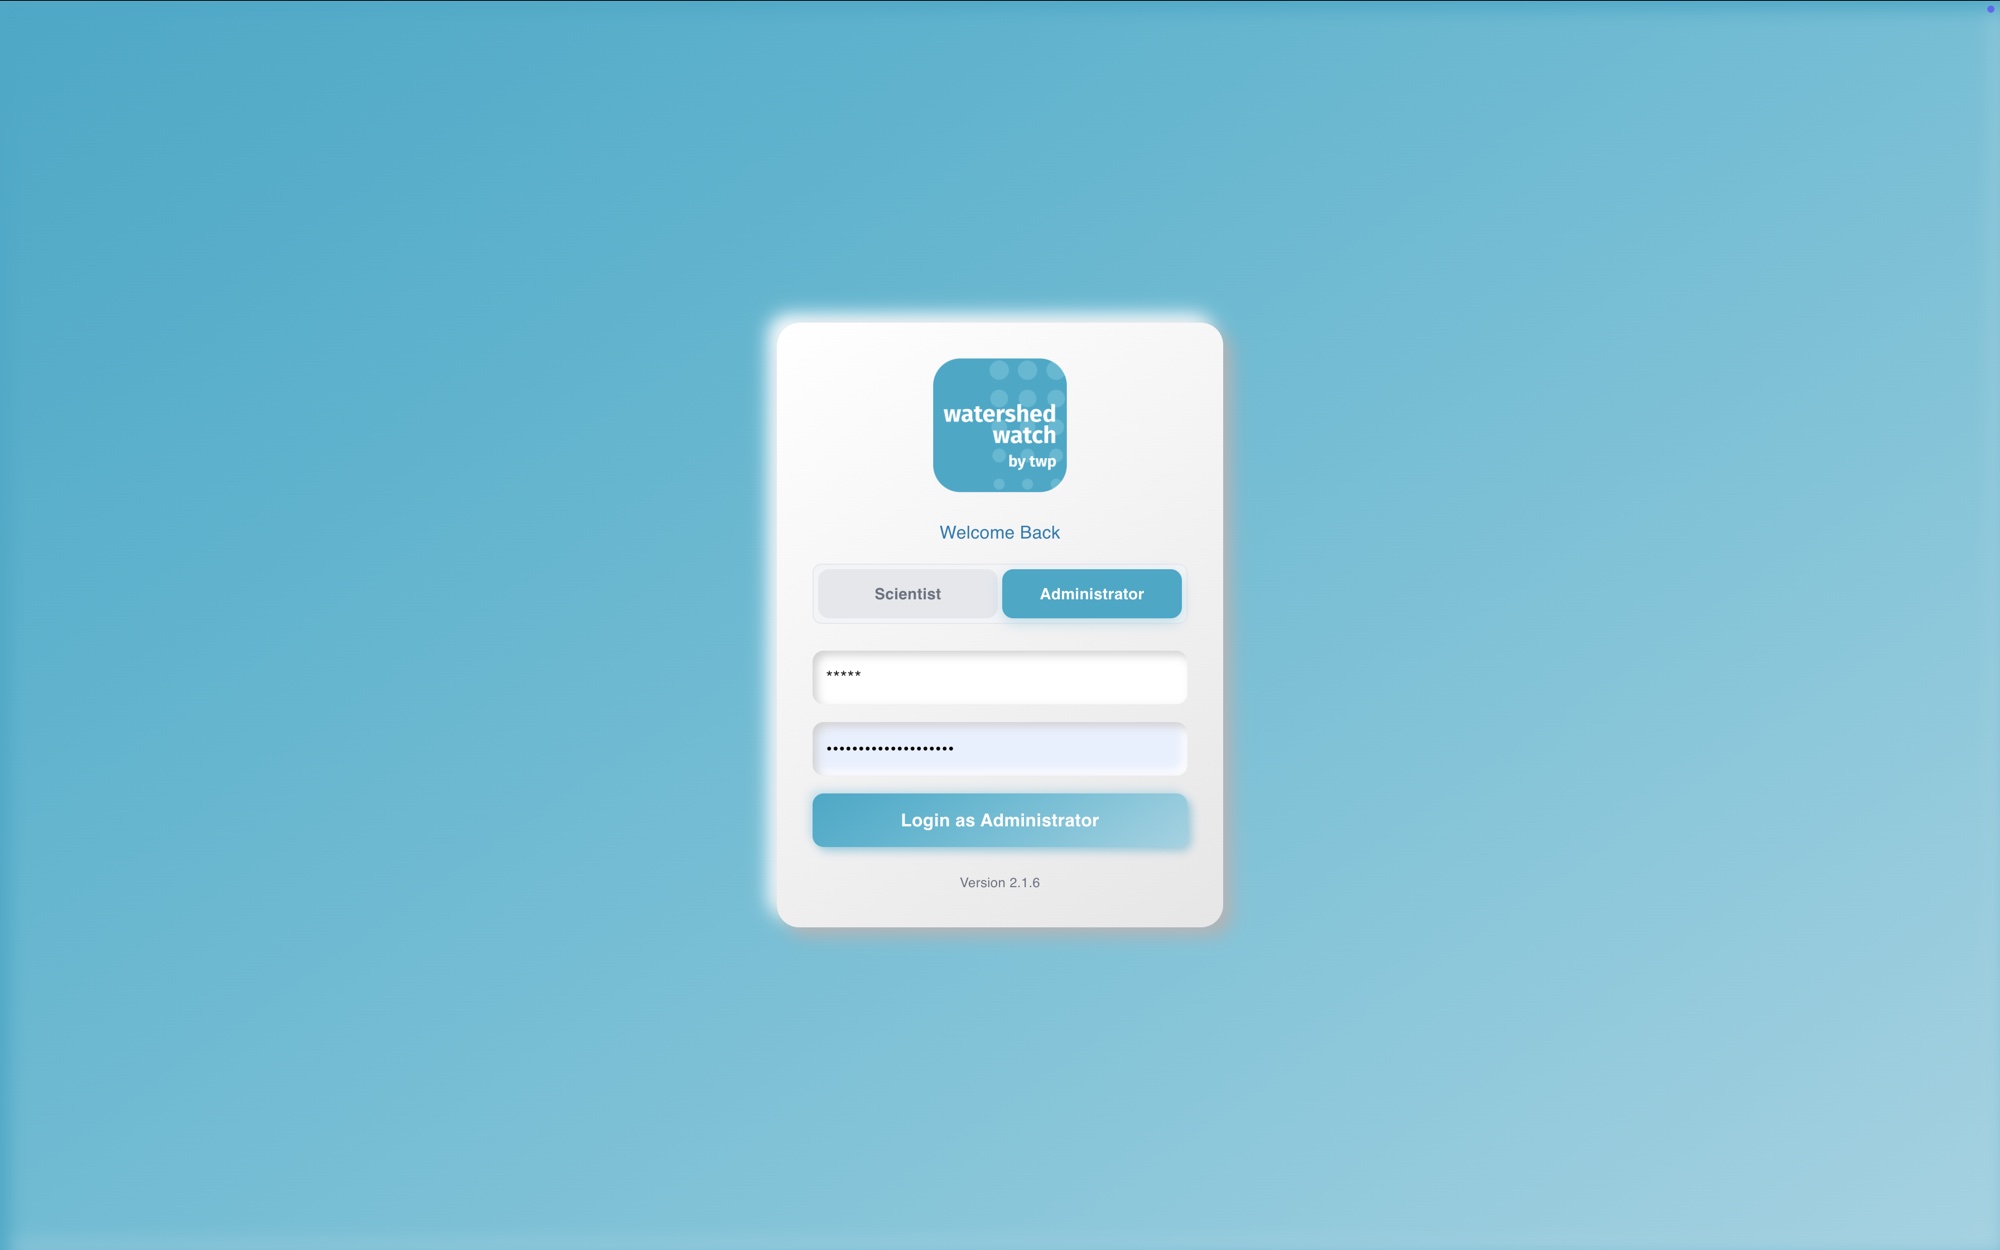
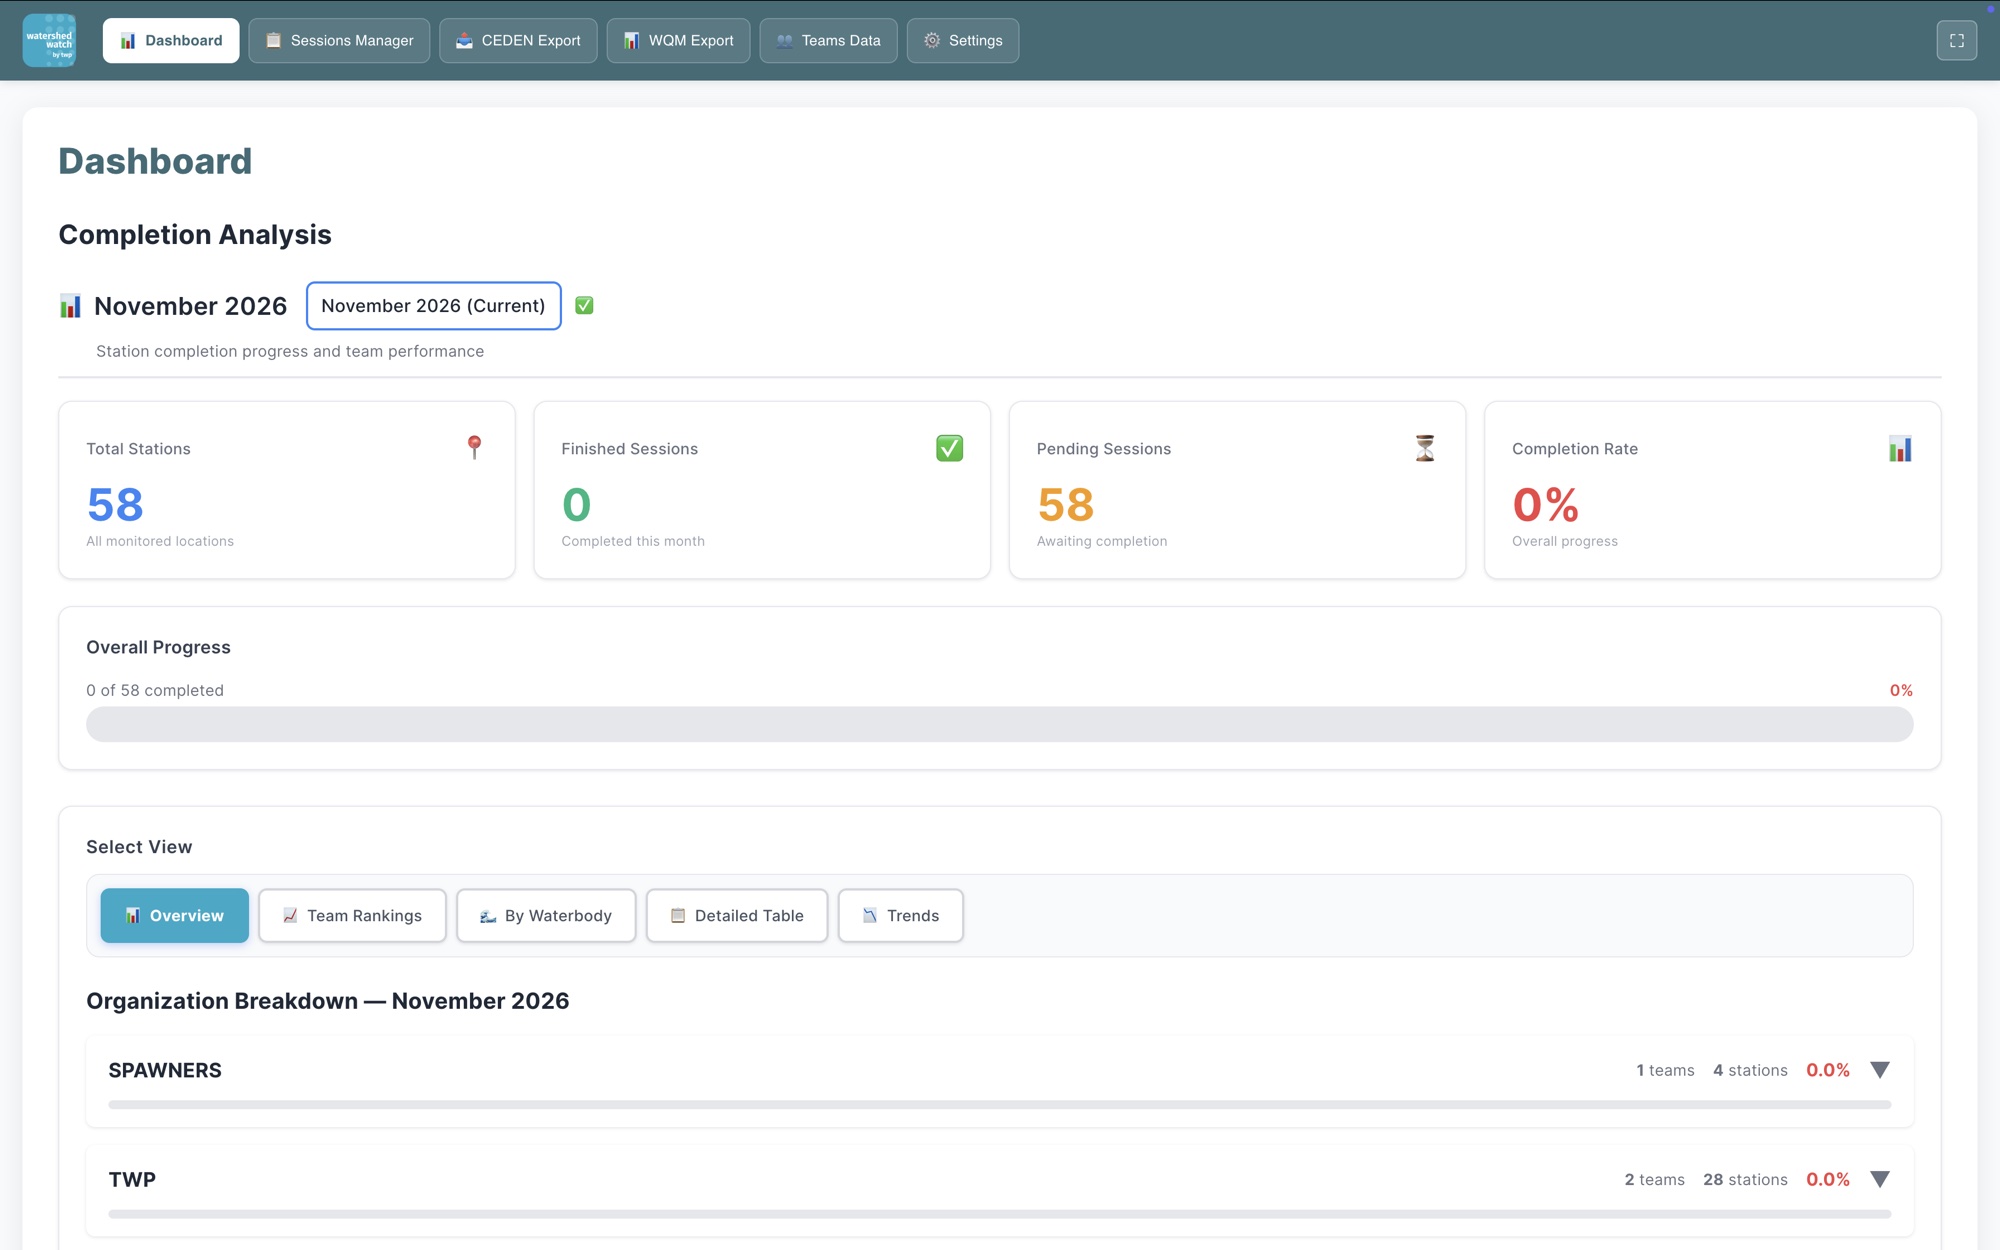
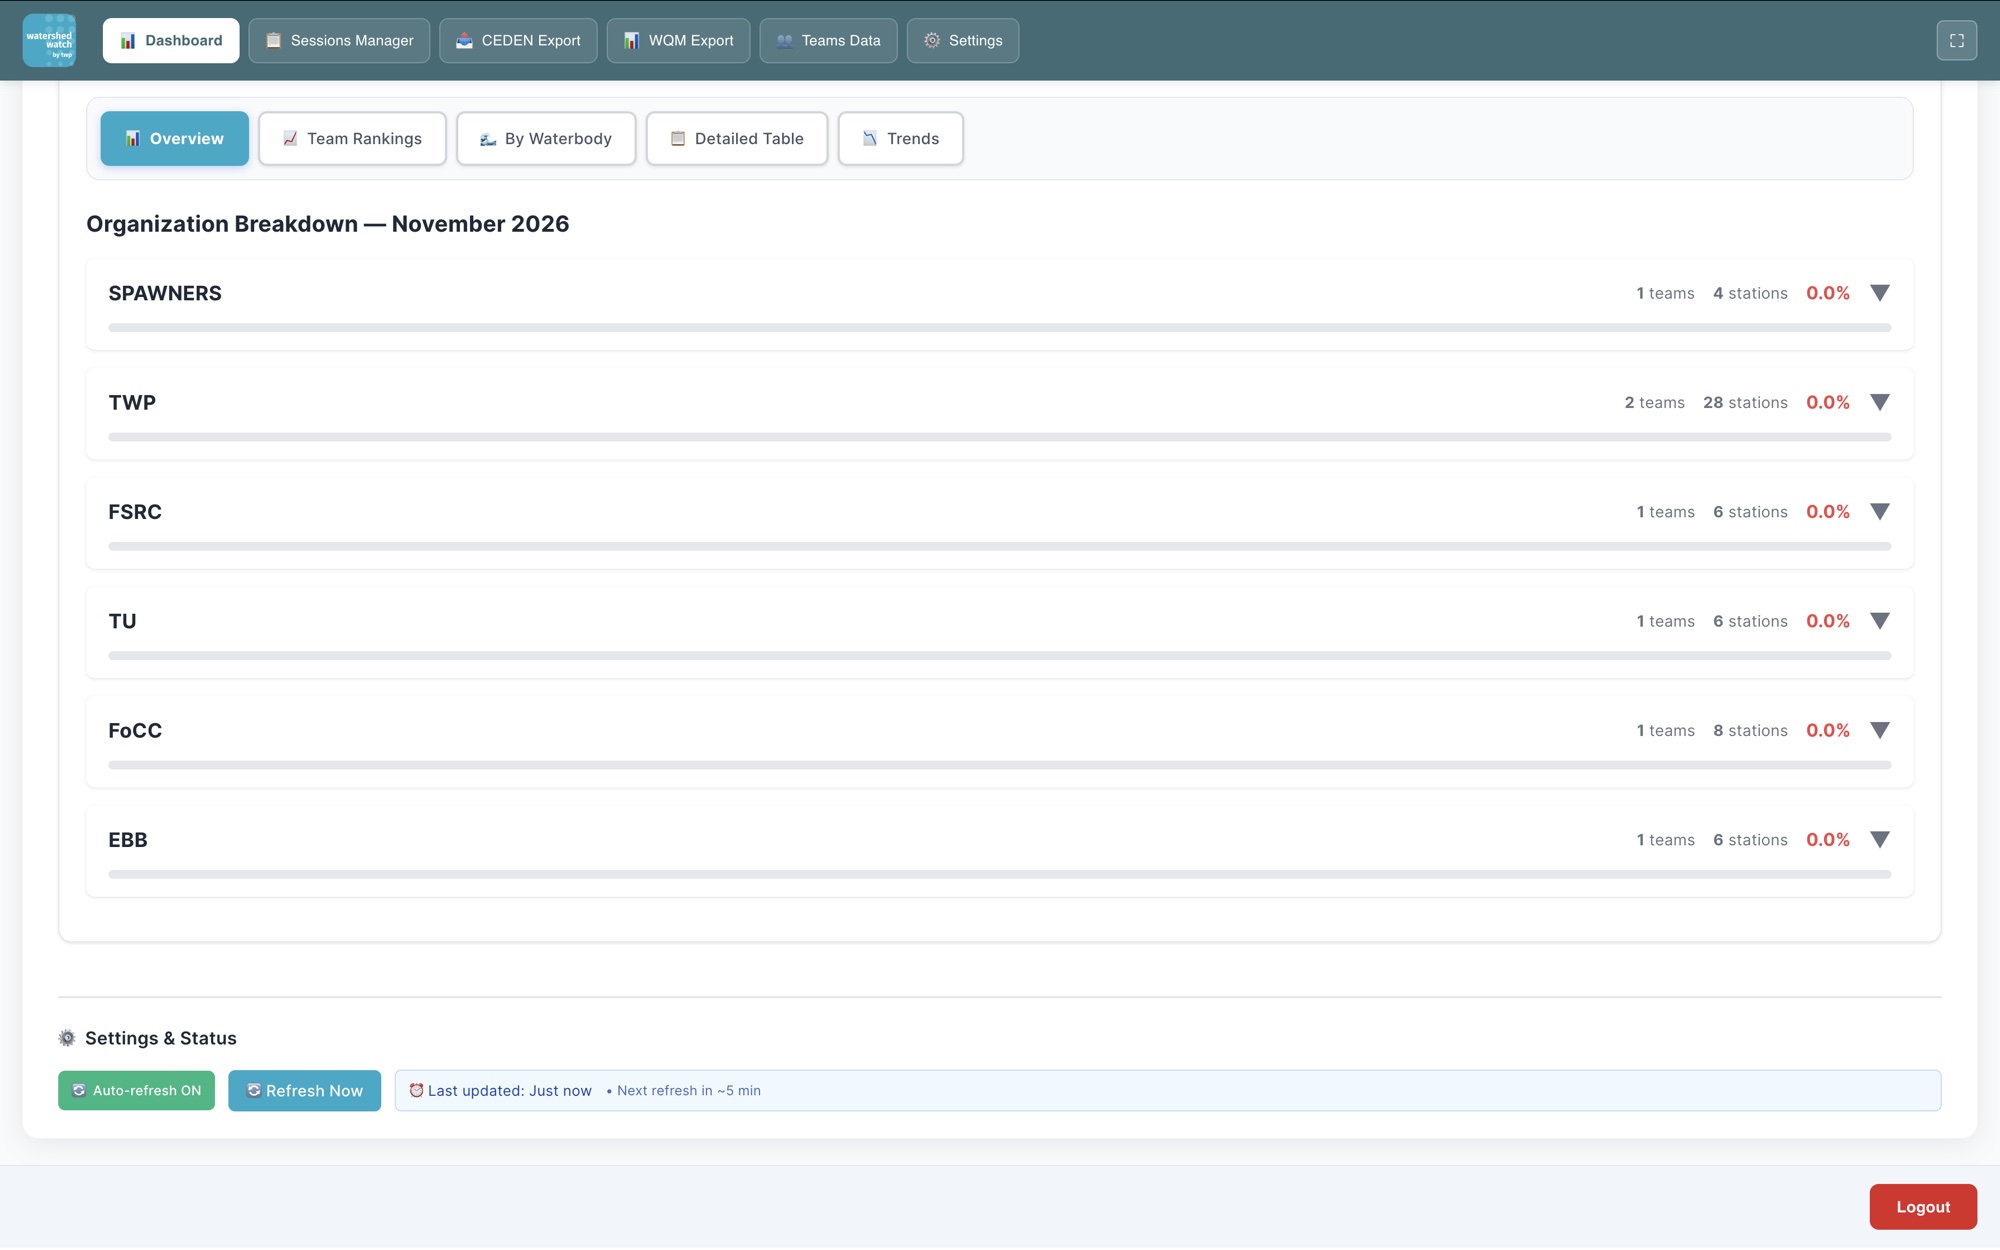
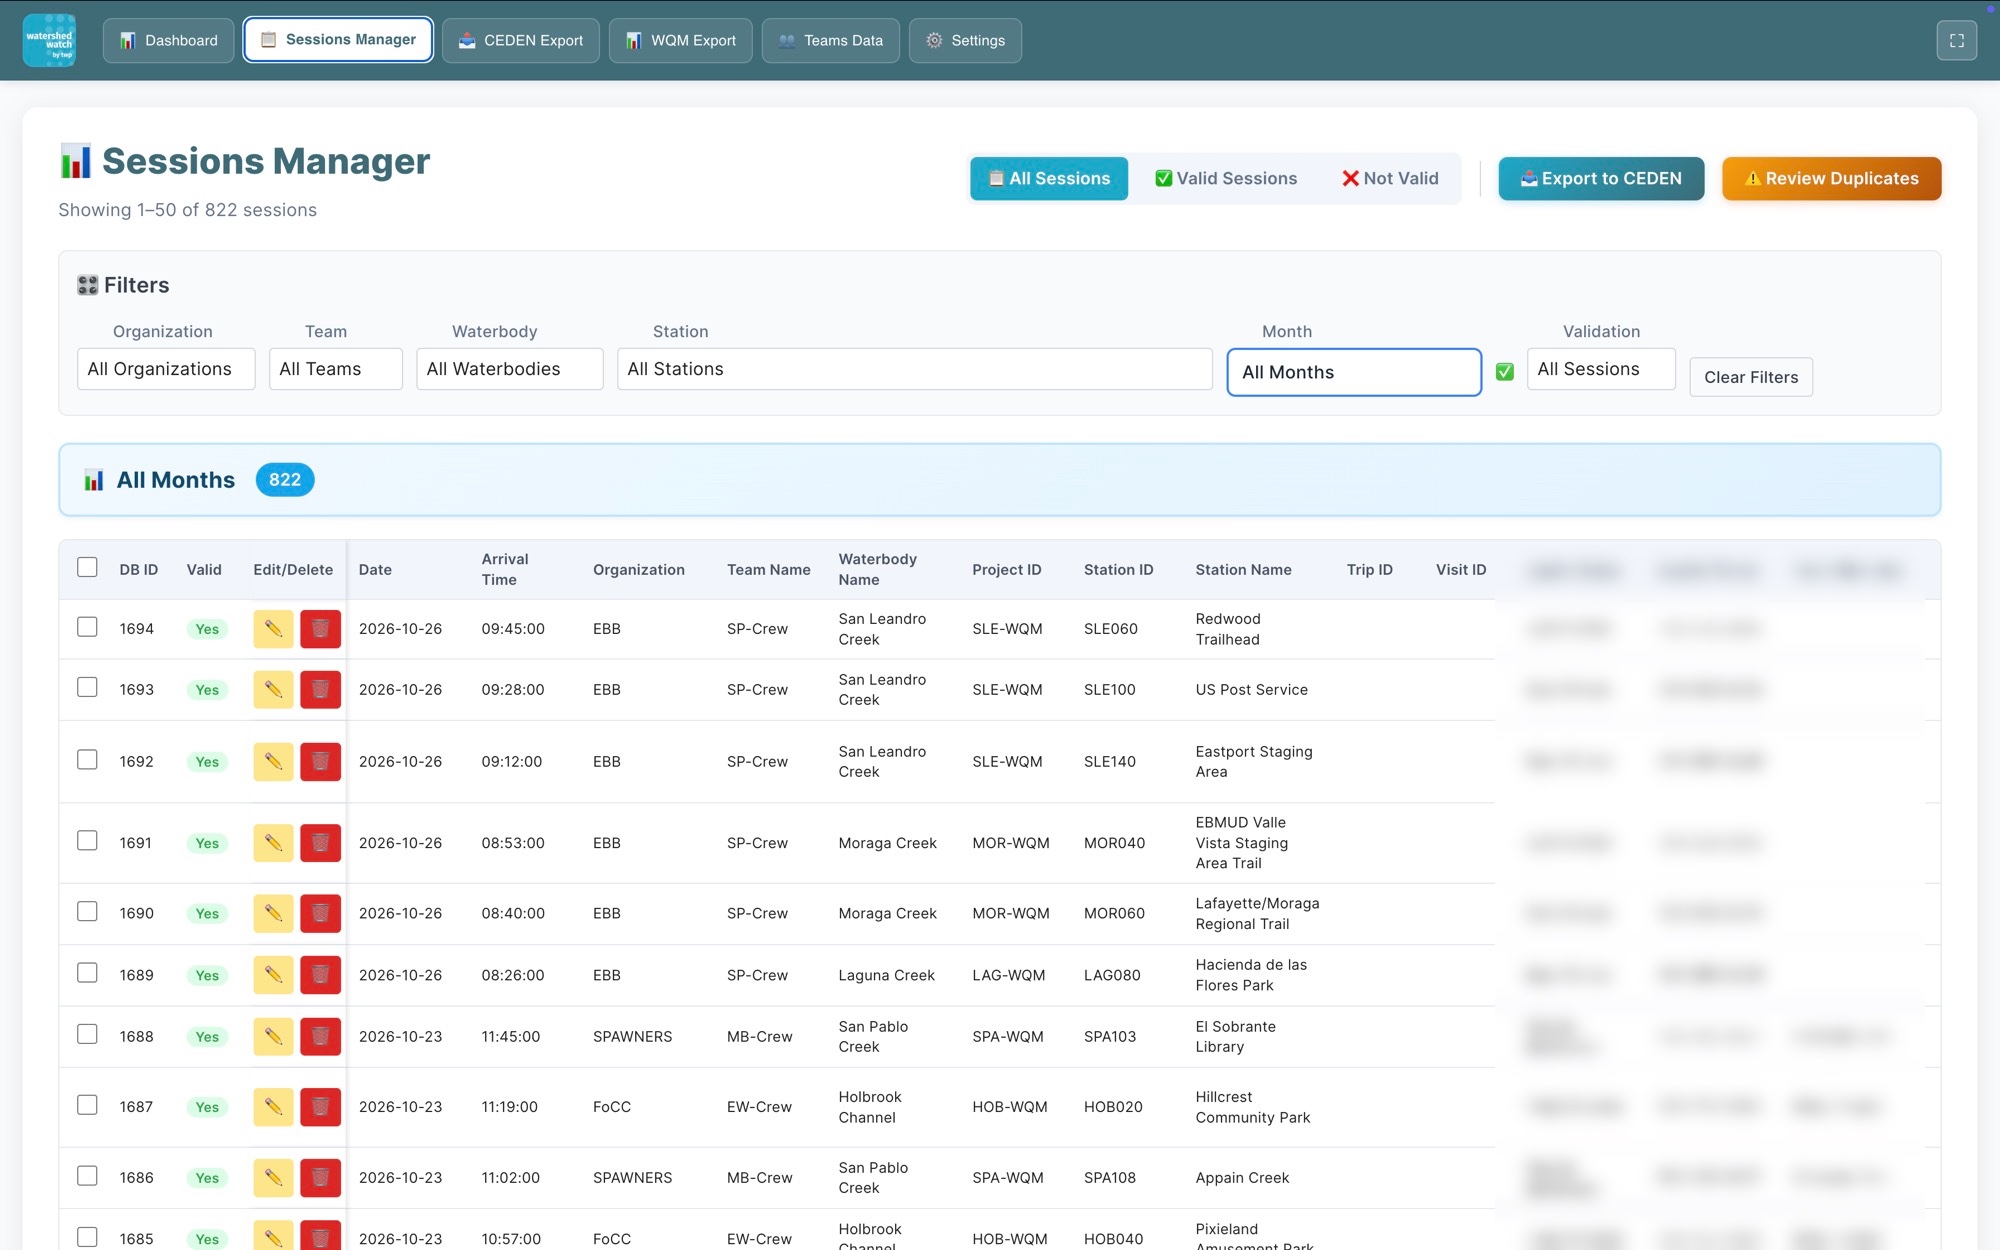
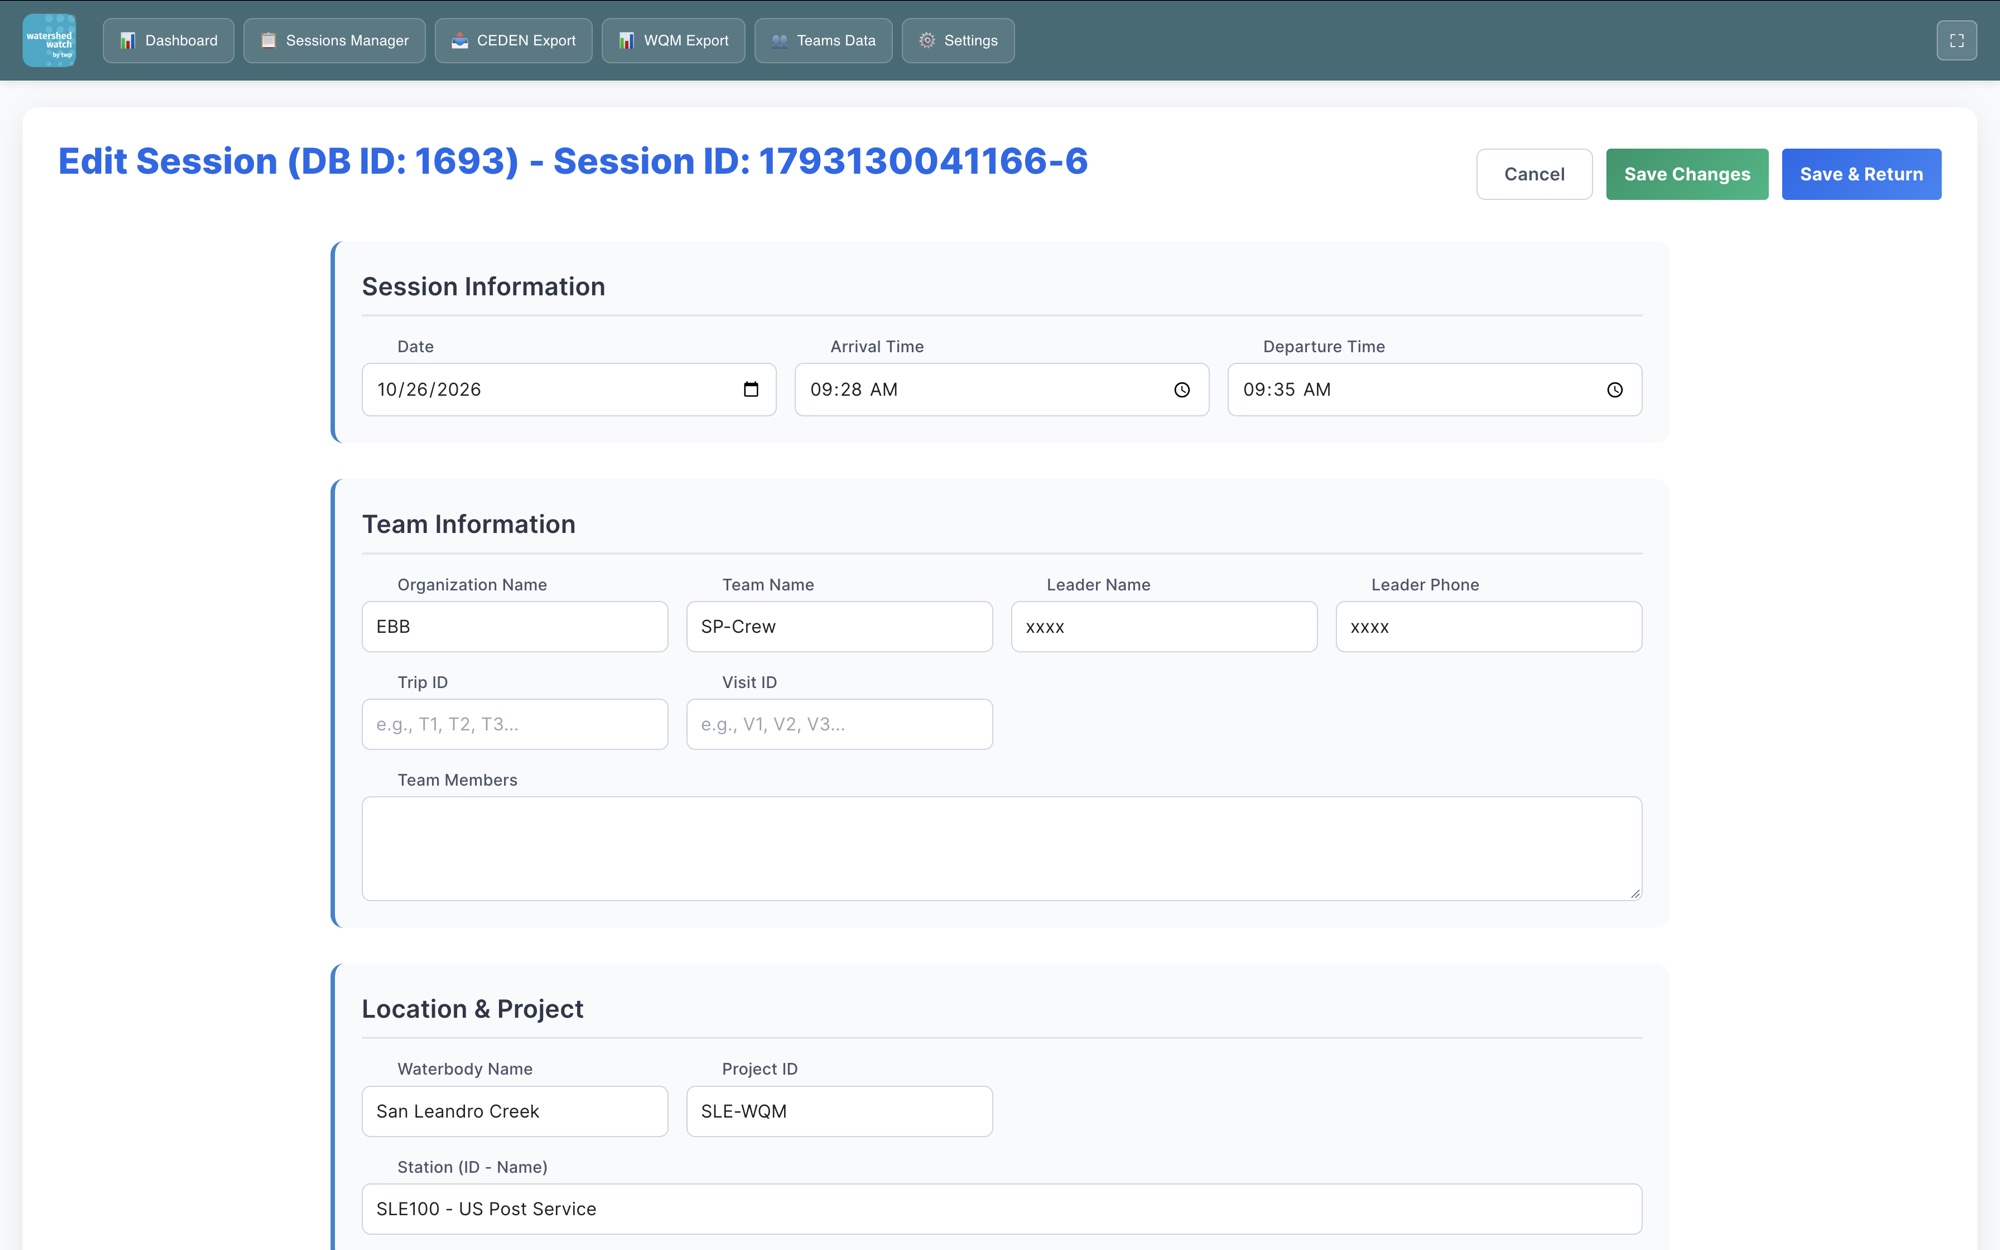
A second, role-restricted interface for program staff (still evolving) covers the full session table with pagination and CEDEN export, a data-quality check for duplicate station-and-date sessions and finished sessions with no measurements, session editing, team and team-contact management, station and organization settings, and an analytics dashboard.
Under the hood
- Front end: React 18 and TypeScript, Material UI with Tailwind, Recharts for analytics, installable as a PWA with local storage-based state.
- Back end: PHP API on MySQL.
- Coverage: 58 monitoring stations across 15 creeks and waterbodies, run by TWP and its partner-organization teams.
- Release process: versioned production releases, currently at v2.1.
The team:
Sebastian Gonzalez Dixon / Setian Studio: App design and development (front end, back end and data exports)
Client: The Watershed Project, Richmond, CA